Infographics
How stakeholders shaped PARIS REINFORCE
Description:
This infographic summarises the critical role of stakeholders throughout the PARIS REINFORCE project, emphasising its truly co-creative nature. Thousands of stakeholders were involved in the project, be that in the form of online surveys or with a more active role in stakeholder workshops. Insights from stakeholders were used to co-design scenario frameworks, co-produce mitigation pathways, and/or co-create transformative policy strategies.
Infographic:
Representation of socioeconomics in integrated assessment models
Description:
This infographic sets out to explain how socioeconomic variables are represented in climate-economy and energy quantitative system models. It also illustrates how each socioeconomic variable is represented in the PARIS REINFORCE modelling suite.
To view how different socioeconomic dimensions, policies, mitigation and adaptation technologies, greenhouse gas emissions and other pollutants, economic sectors, and Sustainable Development Goals are represented in each of the models, please visit the I2AM PARIS platform dynamic documentation, here.
Infographic:
Representation of economic sectors in integrated assessment models
Description:
This infographic sets out to explain how different economic sectors are represented in climate-economy and energy quantitative system models. It also illustrates how each sector of the economy is represented in the PARIS REINFORCE modelling suite.
To view how different socioeconomic dimensions, policies, mitigation and adaptation technologies, greenhouse gas emissions and other pollutants, economic sectors, and Sustainable Development Goals are represented in each of the models, please visit the I2AM PARIS platform dynamic documentation, here.
Infographic:
Representation of policies in integrated assessment models
Description:
This infographic sets out to explain how different types of policy instruments and strategies are represented in climate-economy and energy quantitative system models. It also illustrates how each policy is represented in the PARIS REINFORCE modelling suite.
To view how different socioeconomic dimensions, policies, mitigation and adaptation technologies, greenhouse gas emissions and other pollutants, economic sectors, and Sustainable Development Goals are represented in each of the models, please visit the I2AM PARIS platform dynamic documentation, here.
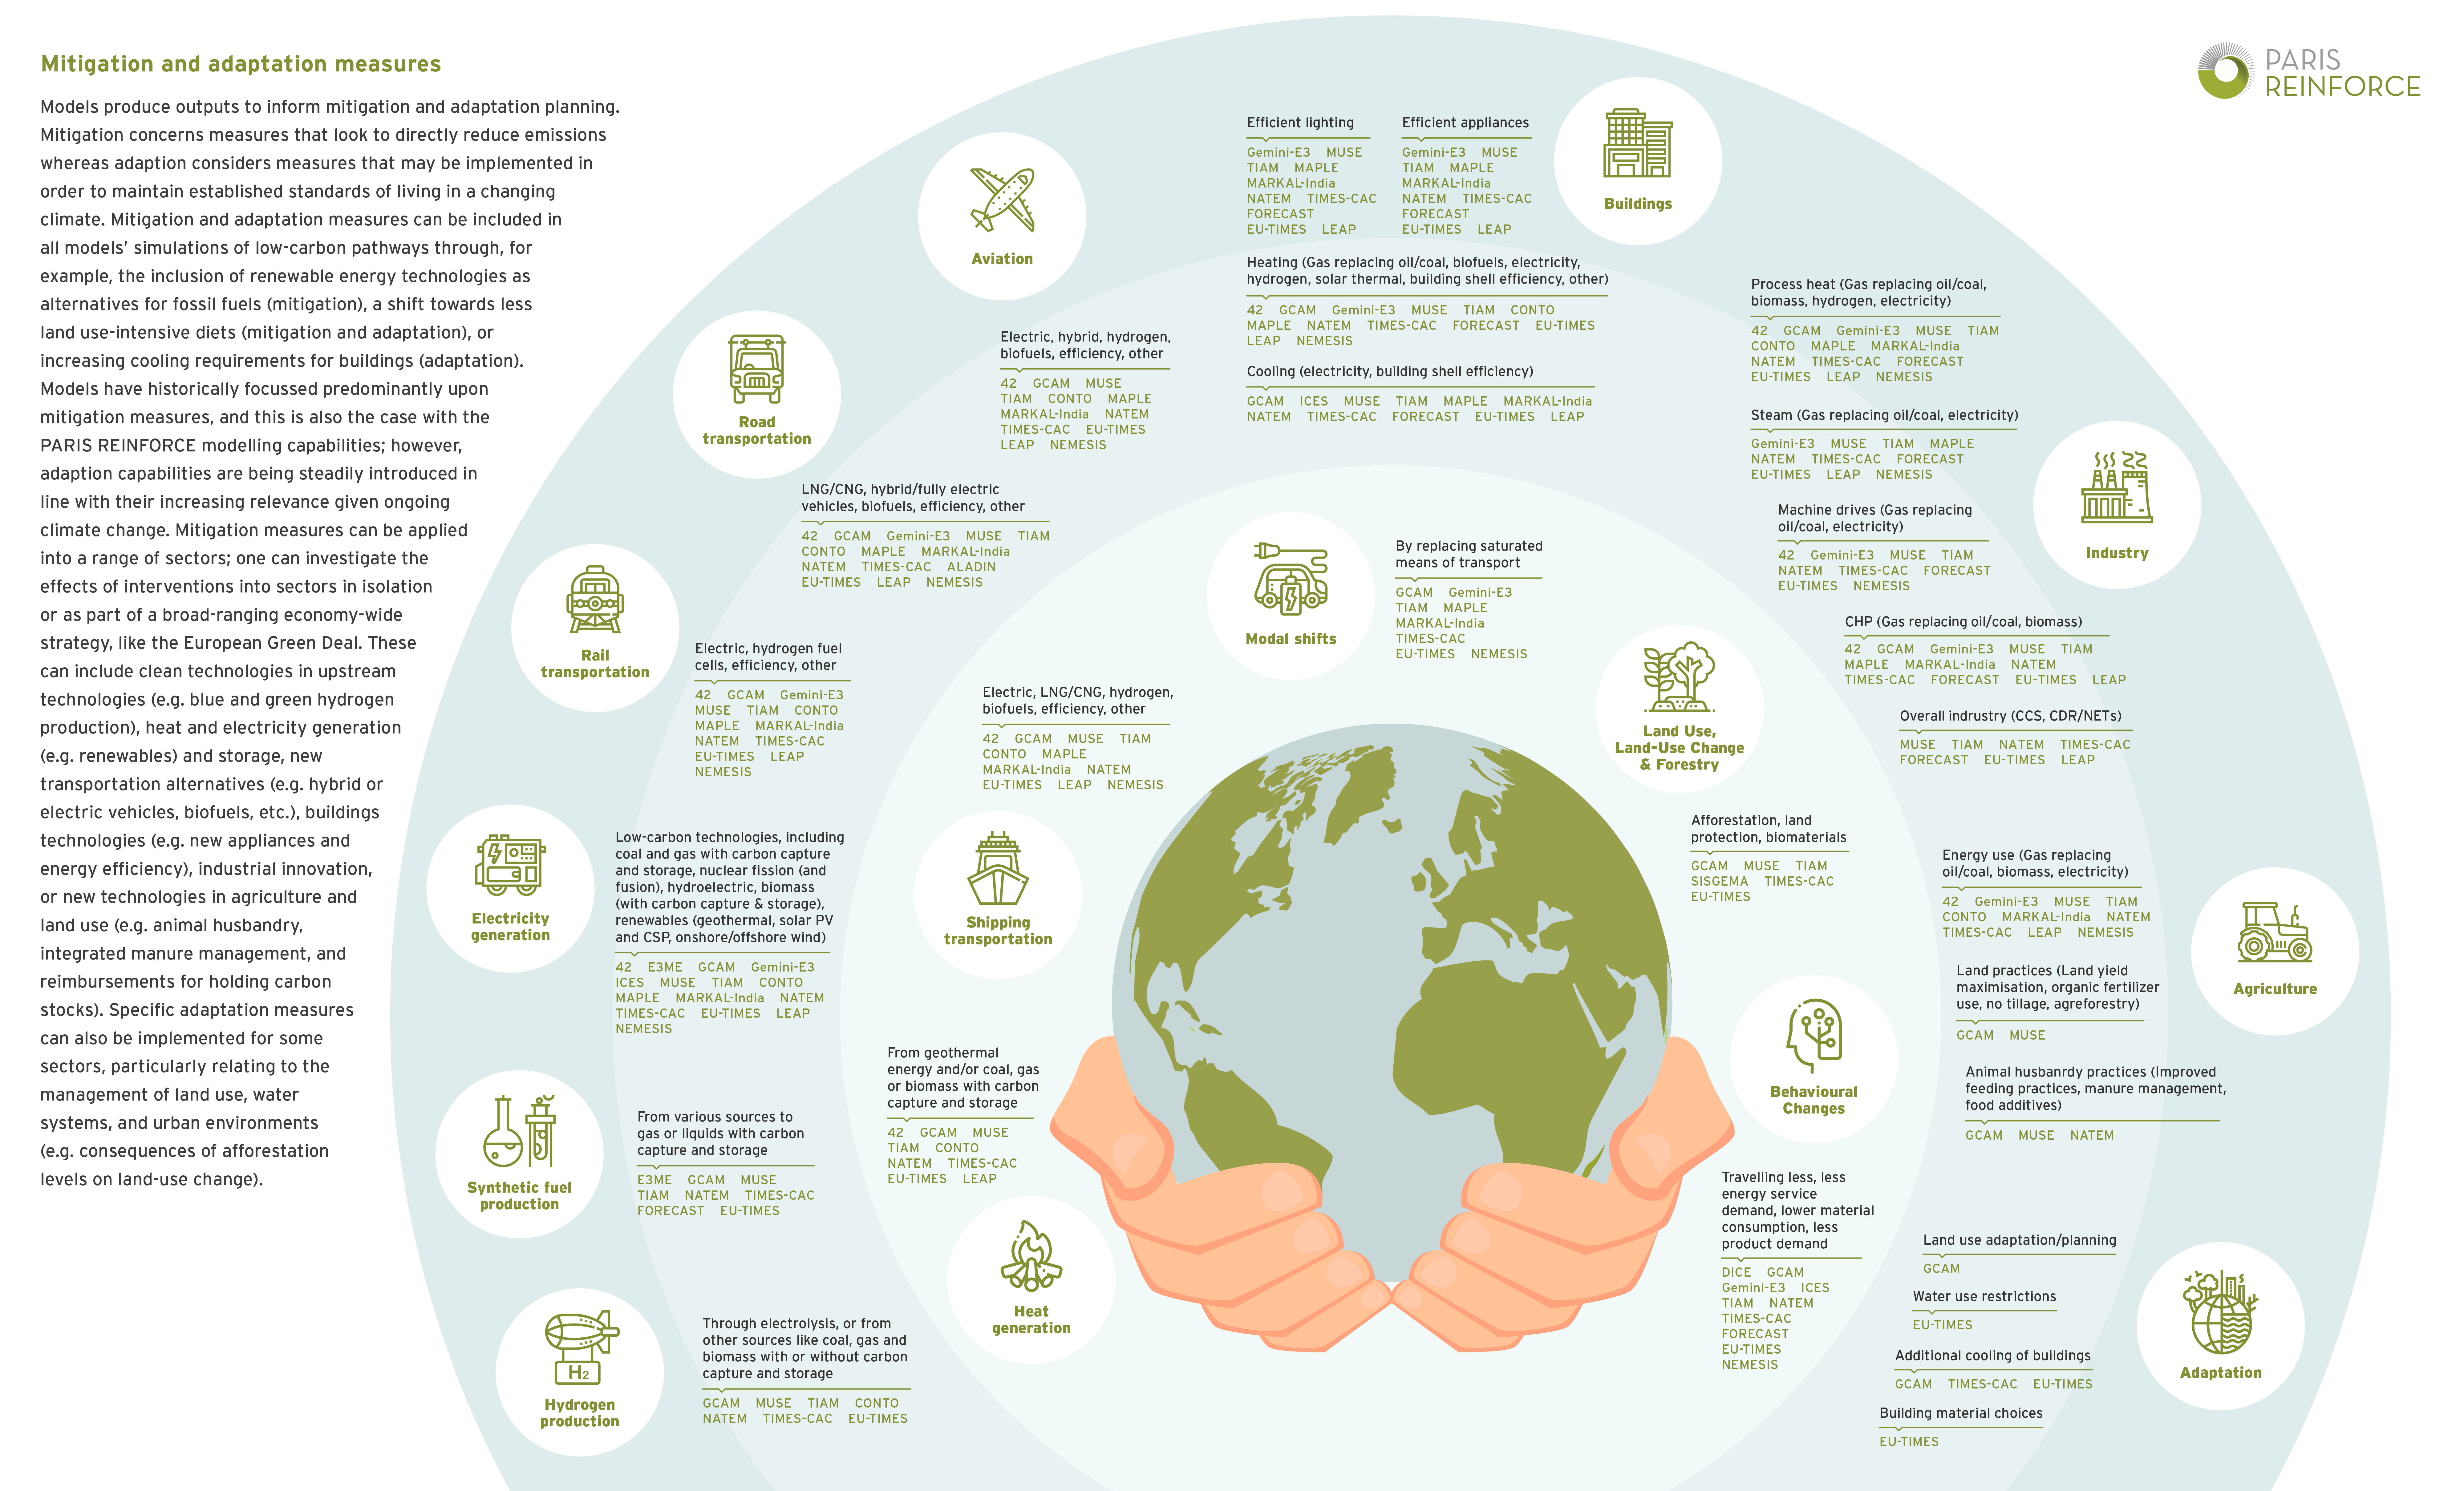
Infographic:

Representation of mitigation and adaptation measures in integrated assessment models
Description:
This infographic sets out to explain how different mitigation and adaptation technologies are represented in climate-economy and energy quantitative system models. It also illustrates how each mitigation and adaptation measure is represented in the PARIS REINFORCE modelling suite.
To view how different socioeconomic dimensions, policies, mitigation and adaptation technologies, greenhouse gas emissions and other pollutants, economic sectors, and Sustainable Development Goals are represented in each of the models, please visit the I2AM PARIS platform dynamic documentation, here.
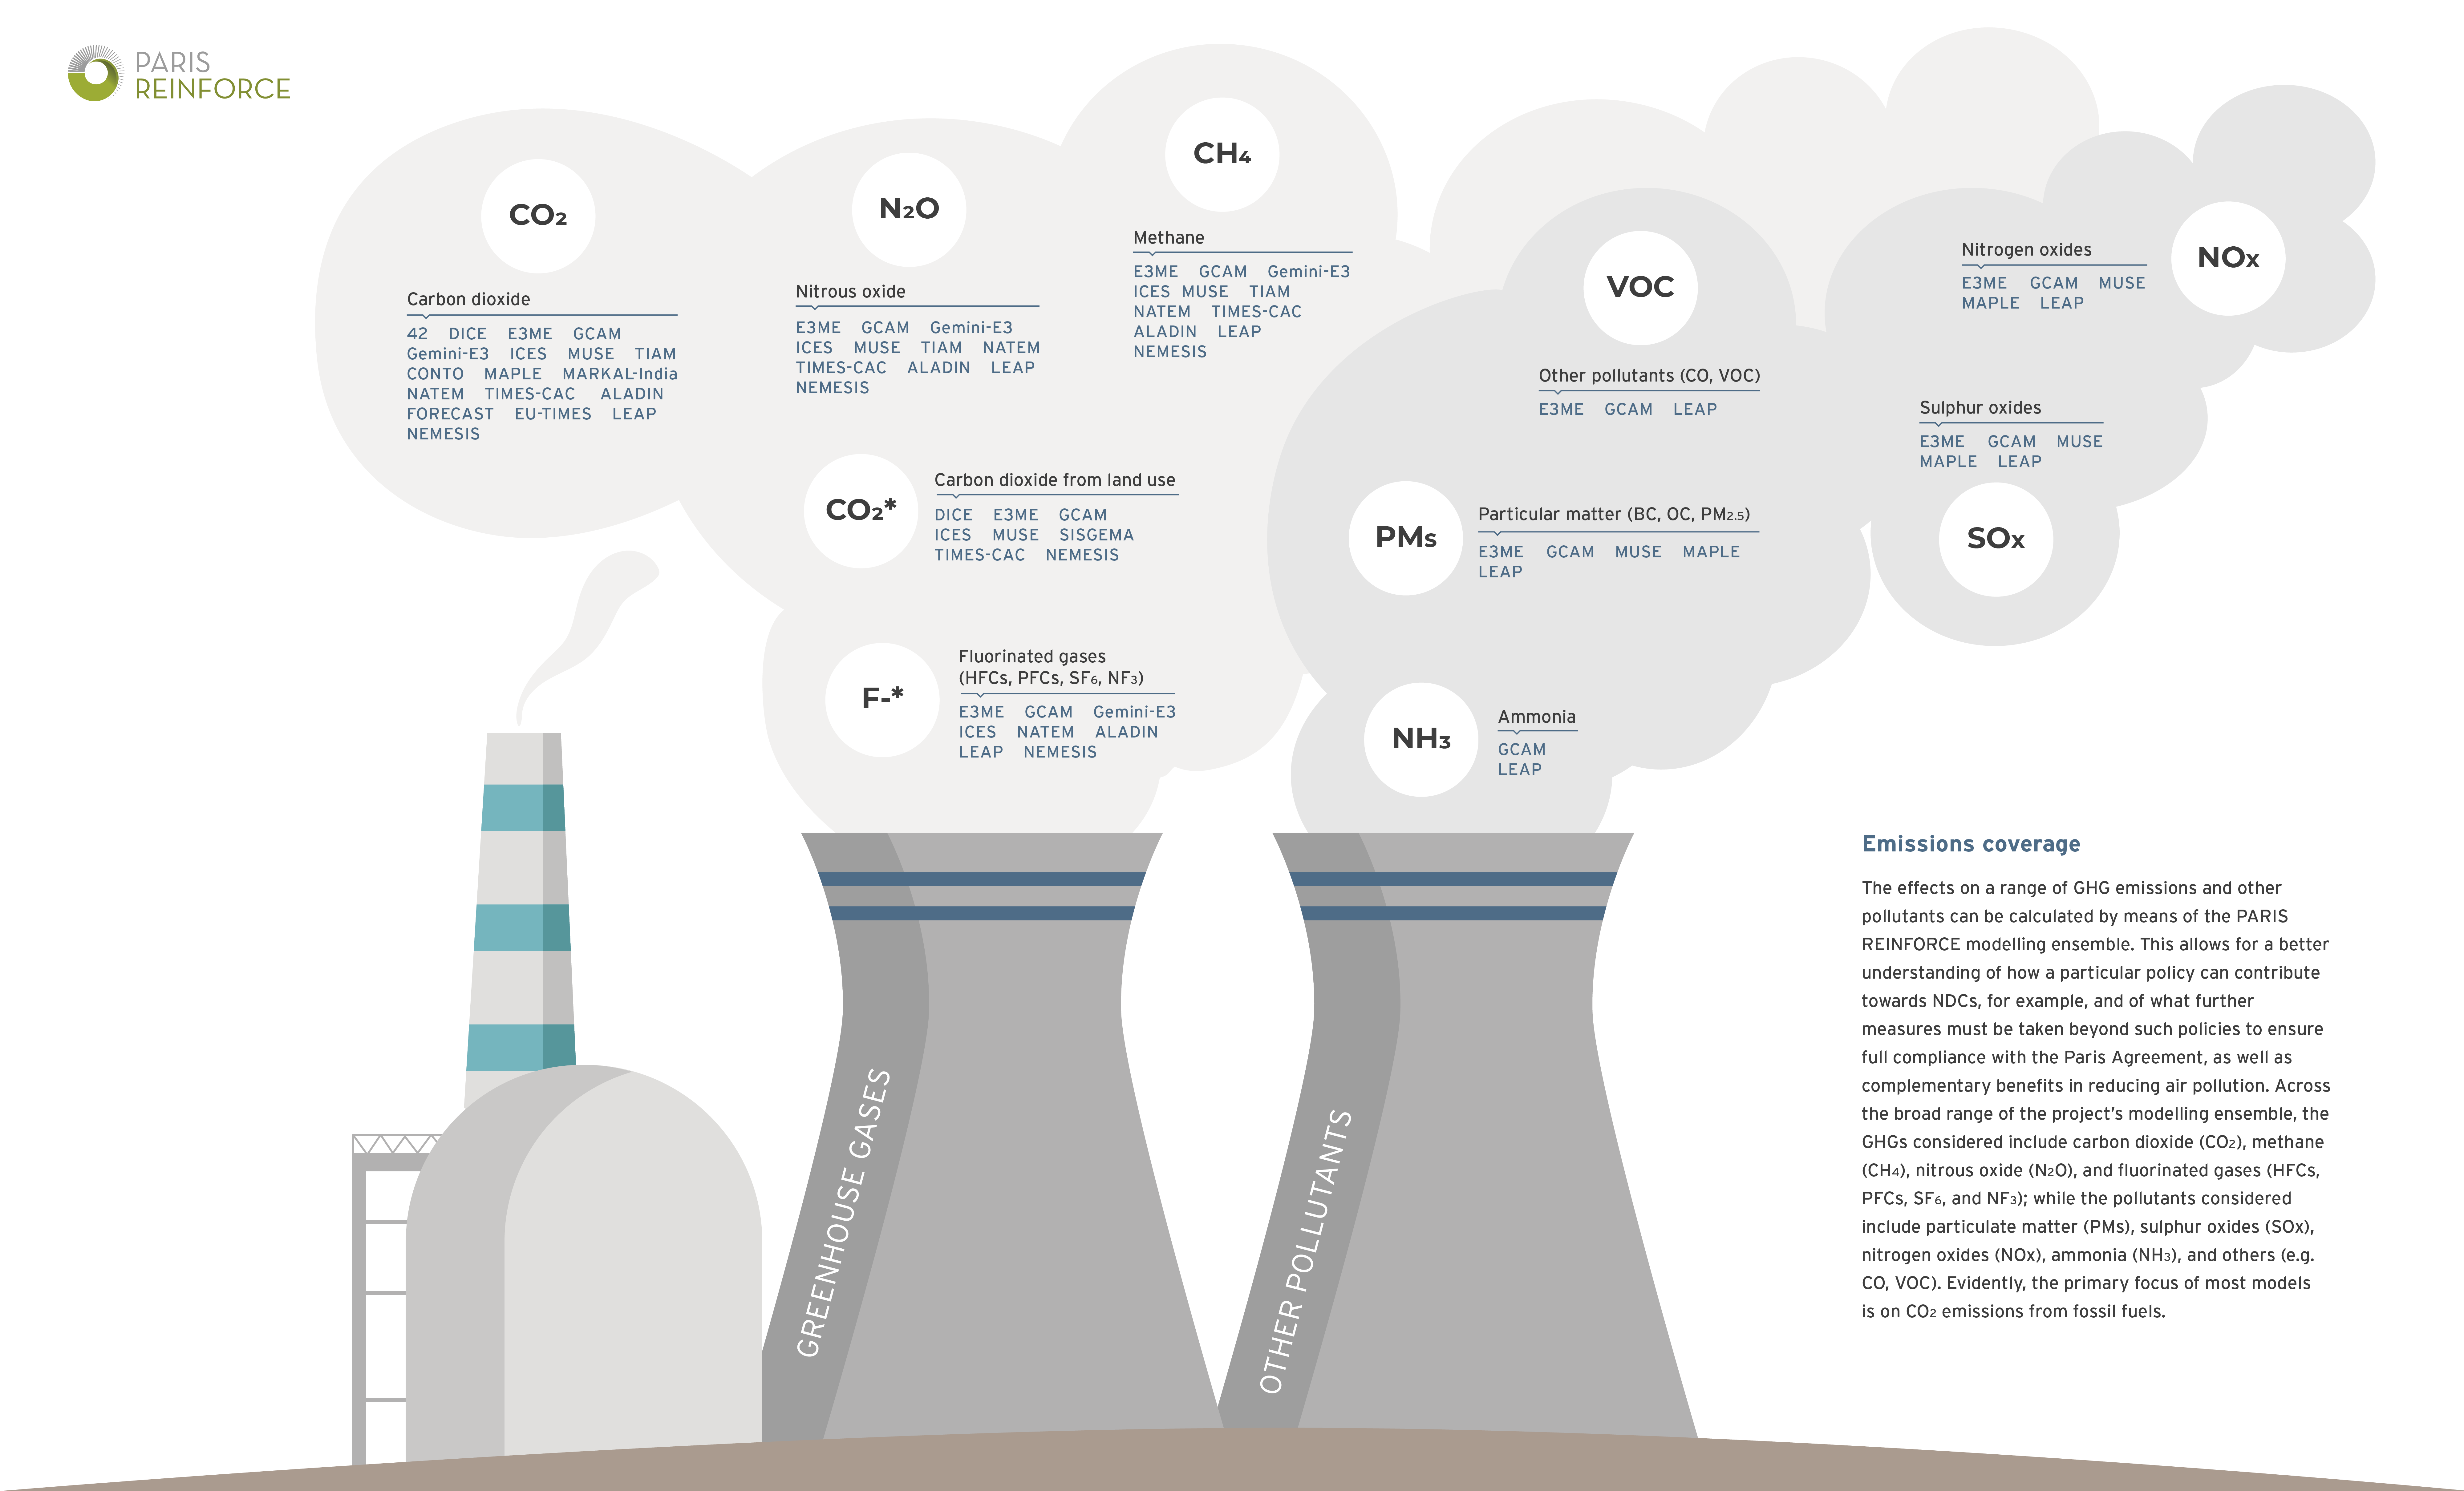
Infographic:
Representation of emissions in integrated assessment models
Description:
This infographic sets out to explain how different greenhouse gas (GHG) emissions and other pollutants are represented in climate-economy and energy quantitative system models. It also illustrates how each emission type is represented in the PARIS REINFORCE modelling suite.
To view how different socioeconomic dimensions, policies, mitigation and adaptation technologies, greenhouse gas emissions and other pollutants, economic sectors, and Sustainable Development Goals are represented in each of the models, please visit the I2AM PARIS platform dynamic documentation, here.
Infographic:
Representation of Sustainable Development Goals in integrated assessment models
Description:
This infographic sets out to explain how Sustainable Development Goals (SDGs) are represented in climate-economy and energy quantitative system models. It also illustrates how each SDG indicator can be extracted by the PARIS REINFORCE modelling suite.
To view how different socioeconomic dimensions, policies, mitigation and adaptation technologies, greenhouse gas emissions and other pollutants, economic sectors, and Sustainable Development Goals are represented in each of the models, please visit the I2AM PARIS platform dynamic documentation, here.
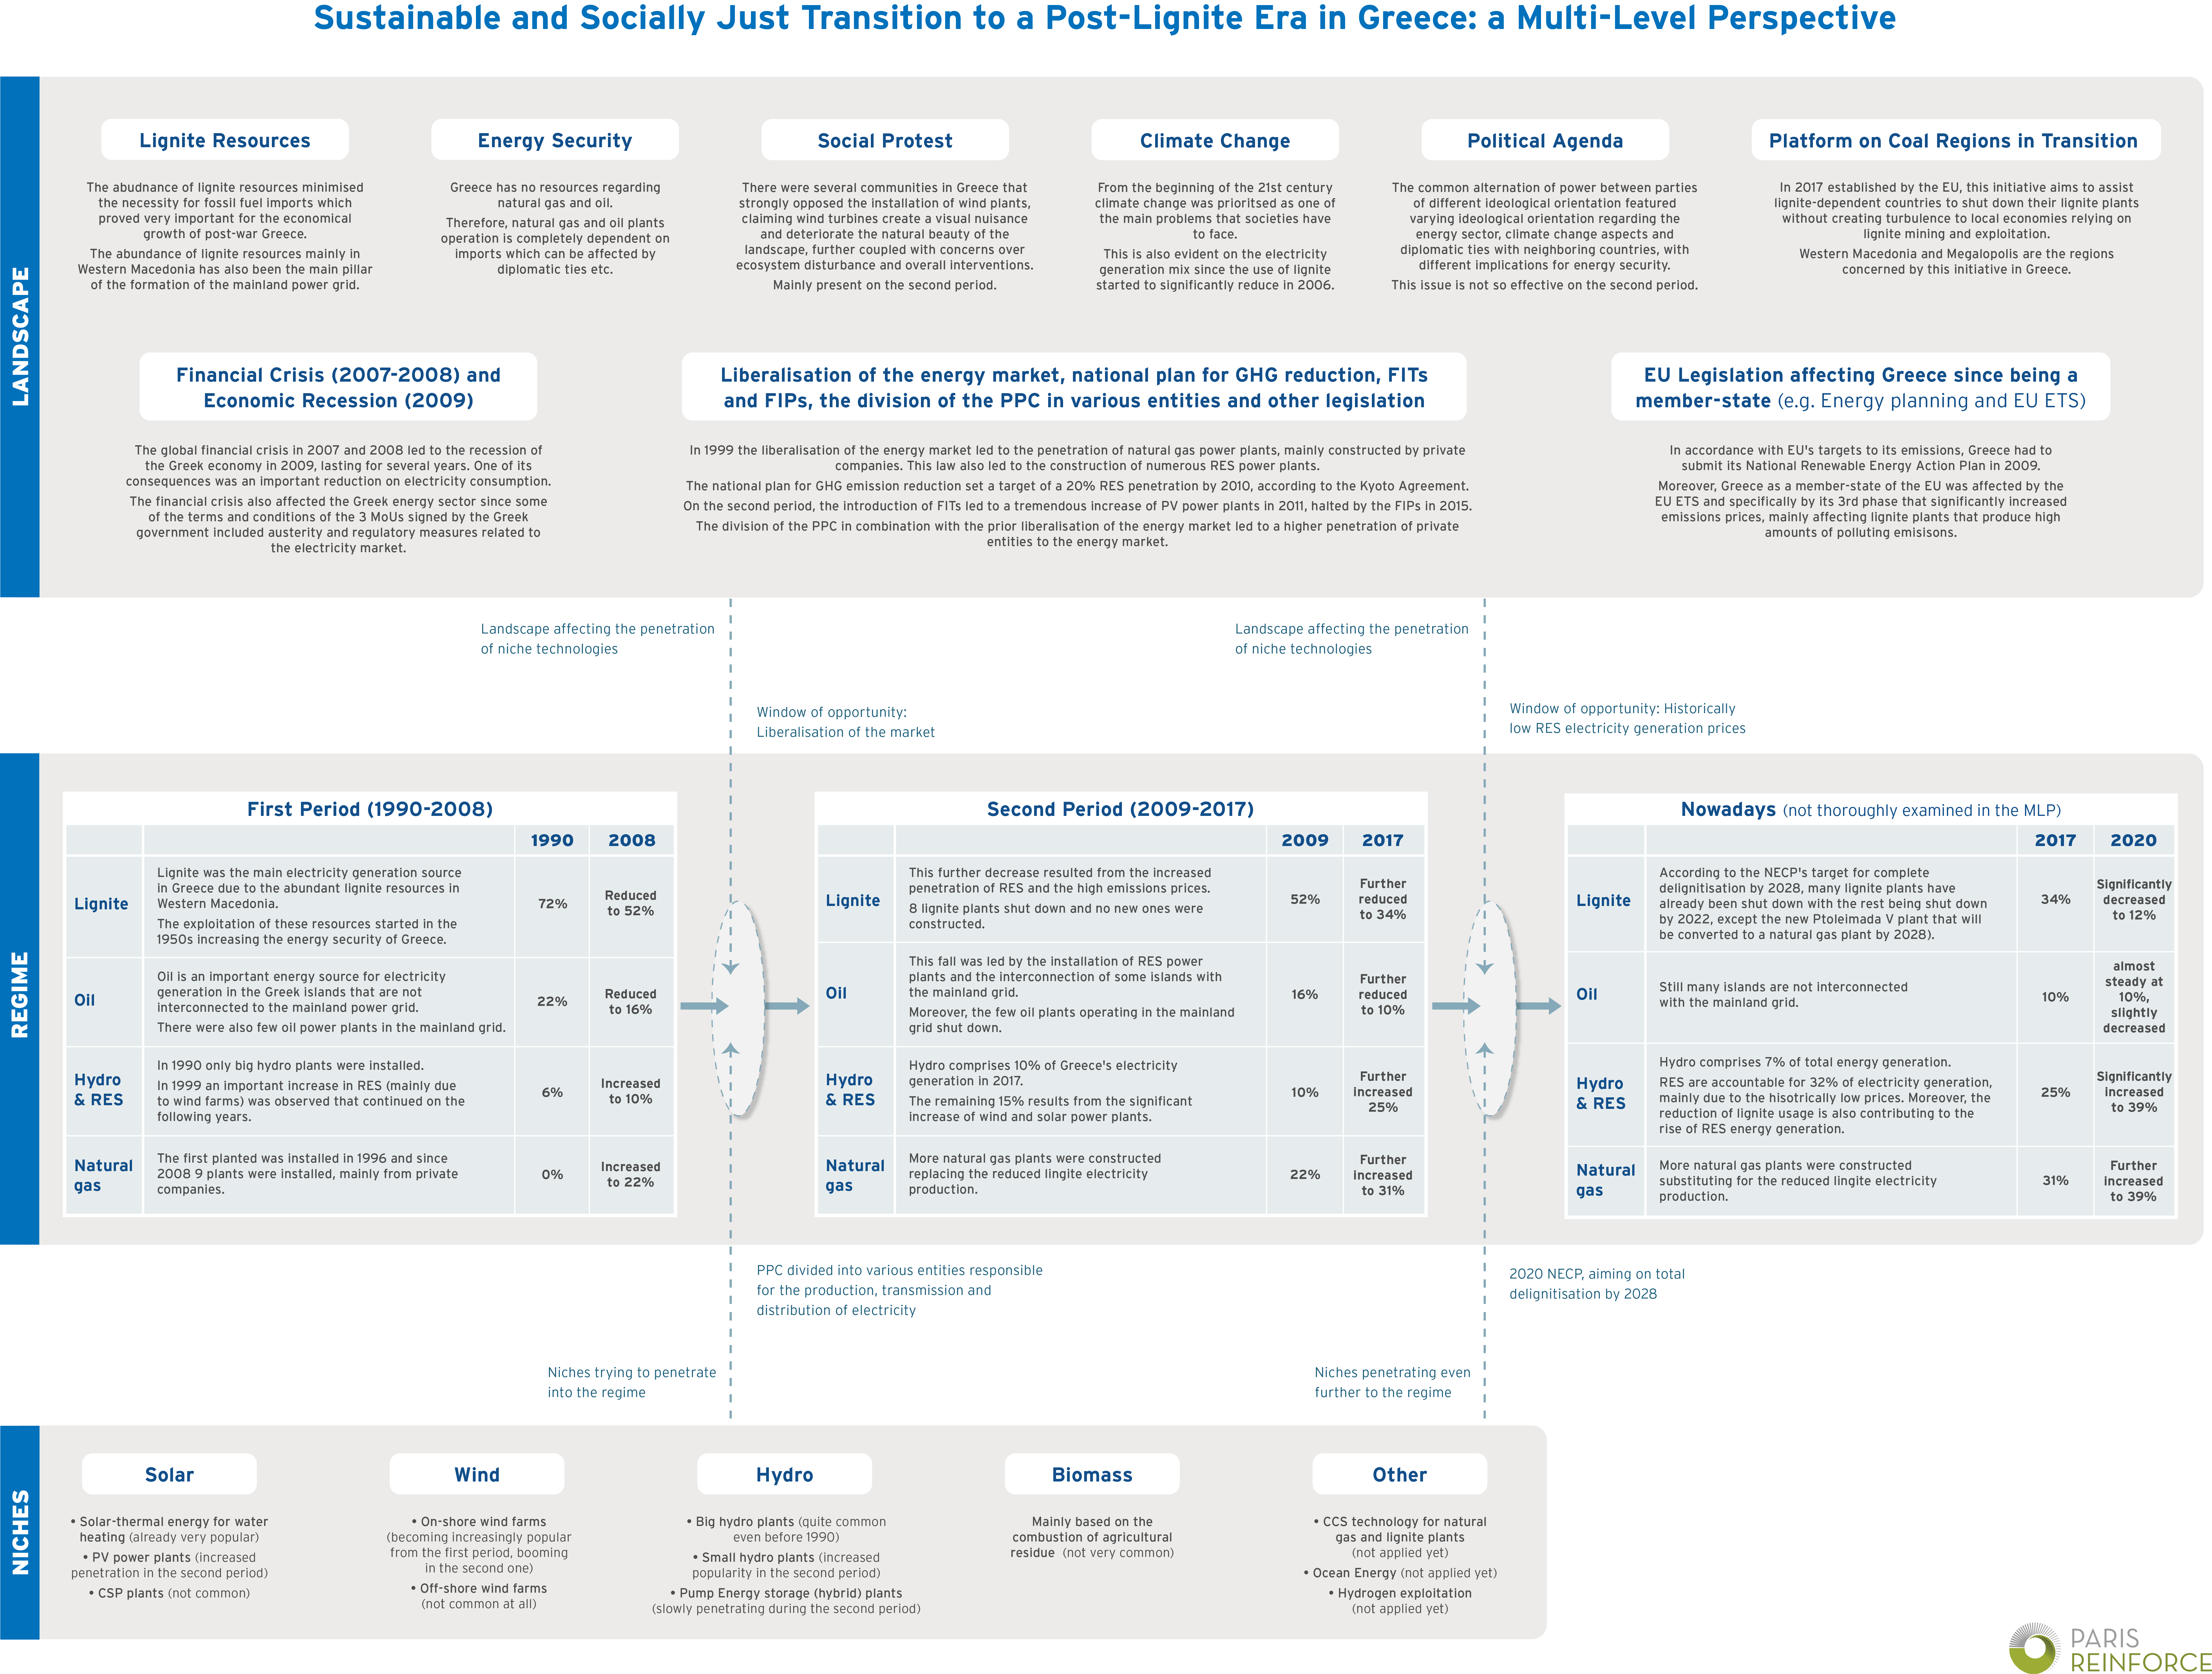
Infographic:

Sustainable and socially just transition to a post-lignite era in Greece: a multi-level perspective
Description:
This infographic builds upon the Multi-Level Perspective framework and further focuses on the phase-out of the dominant fossil fuel in the Greek electricity mix, rather than solely exploring the phase-in of new technologies. By delving into the landscape that established lignite as the mainstream energy resource in Greece, as well as the factors sustaining its dominance despite niche technologies and innovations challenging the regime, it discusses how the envisaged decarbonisation can be socially just and effective across multiple sustainability dimensions.
The infographic is based on:
Nikas, A., Neofytou, H., Karamaneas, A., Koasidis, K., & Psarras, J. (2020). Sustainable and socially just transition to a post-lignite era in Greece: a multi-level perspective. Energy Sources, Part B: Economics, Planning, and Policy, in press.
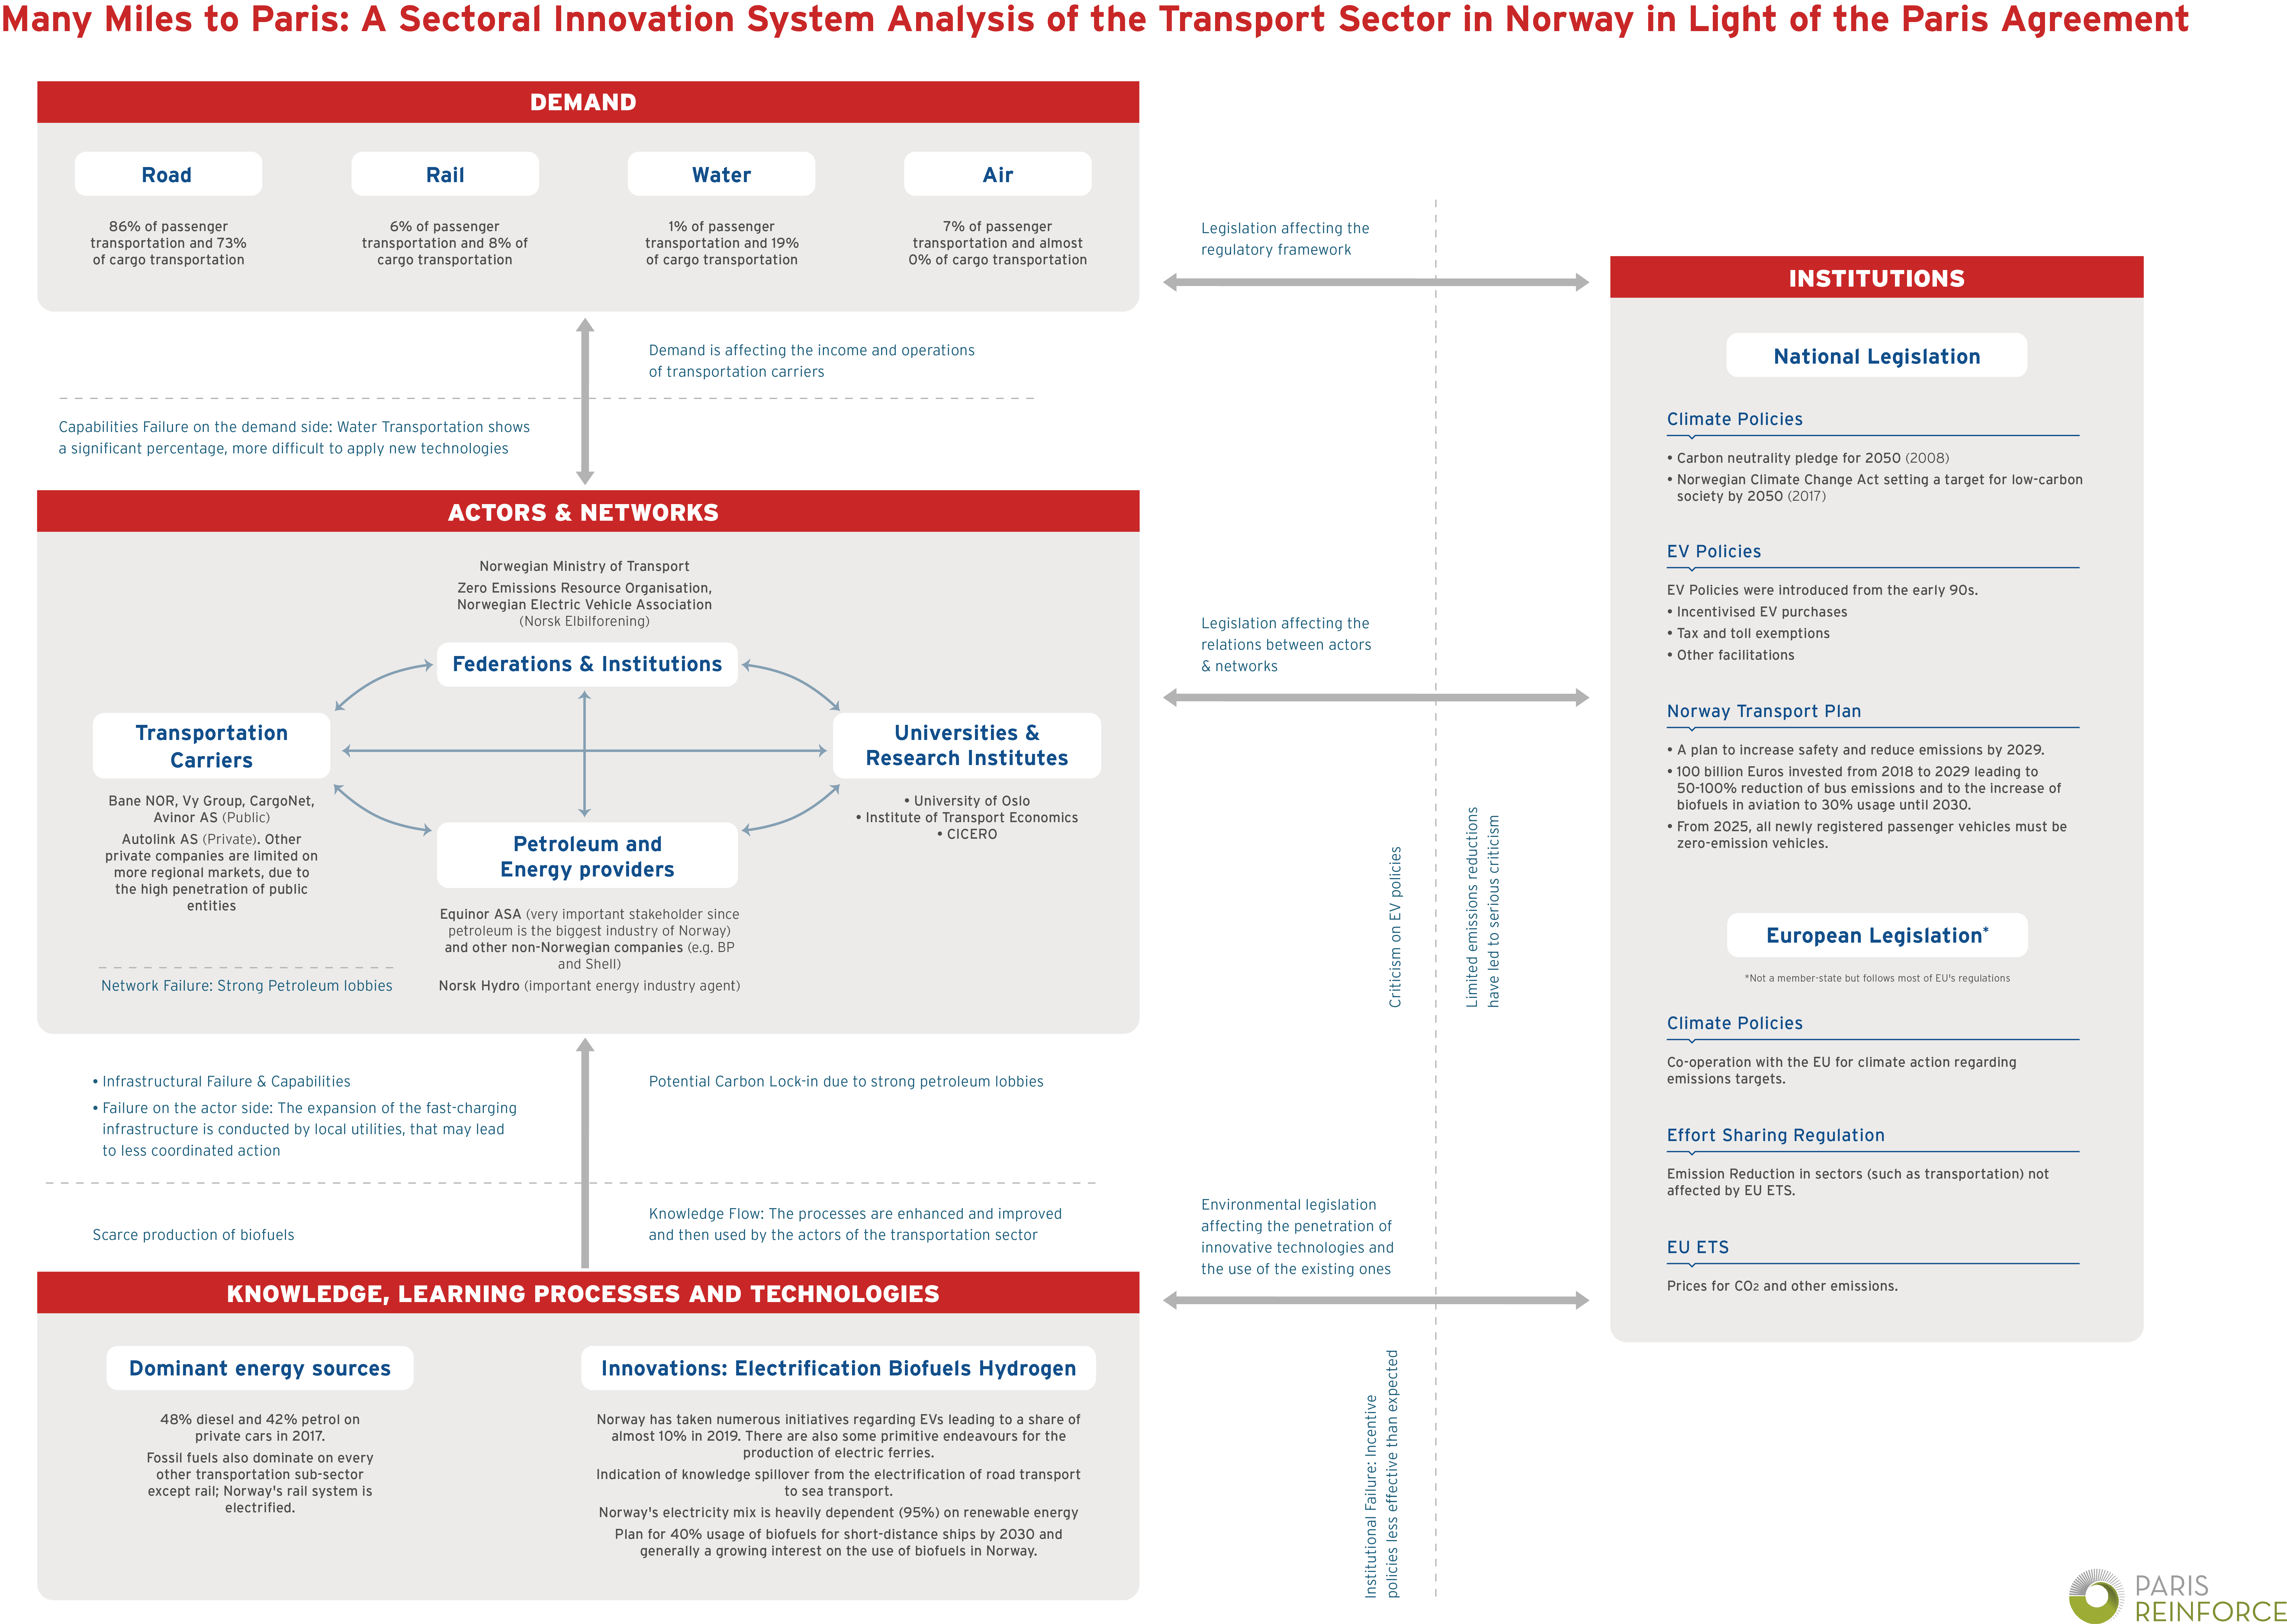
Infographic:
Many Miles to Paris: A Sectoral Innovation System Analysis of the Transport Sector in Norway in Light of the Paris Agreement
Description:
This infographic, based on the Sectoral Innovation Systems approach, attempts to identify the elements enabling Norway to become one of the leaders in the diffusion of electric vehicles. By utilising the System Failure framework, bottlenecks hindering the decarbonisation of the transport system are identified. Results indicate that the effectiveness of Norway’s policy is exaggerated and has led to recent spillover effects towards green shipping. Insights into the effectiveness of previously implemented policies and the evolution of the sectoral system can help draw lessons towards sustainable transport.
The infographic is based on:
Koasidis, K., Karamaneas, A., Nikas, A., Neofytou, H., Hermansen, E. A., Vaillancourt, K., & Doukas, H. (2020). Many miles to Paris: A sectoral innovation system analysis of the transport sector in norway and canada in light of the Paris Agreement. Sustainability, 12(14), 5832.
Infographic:
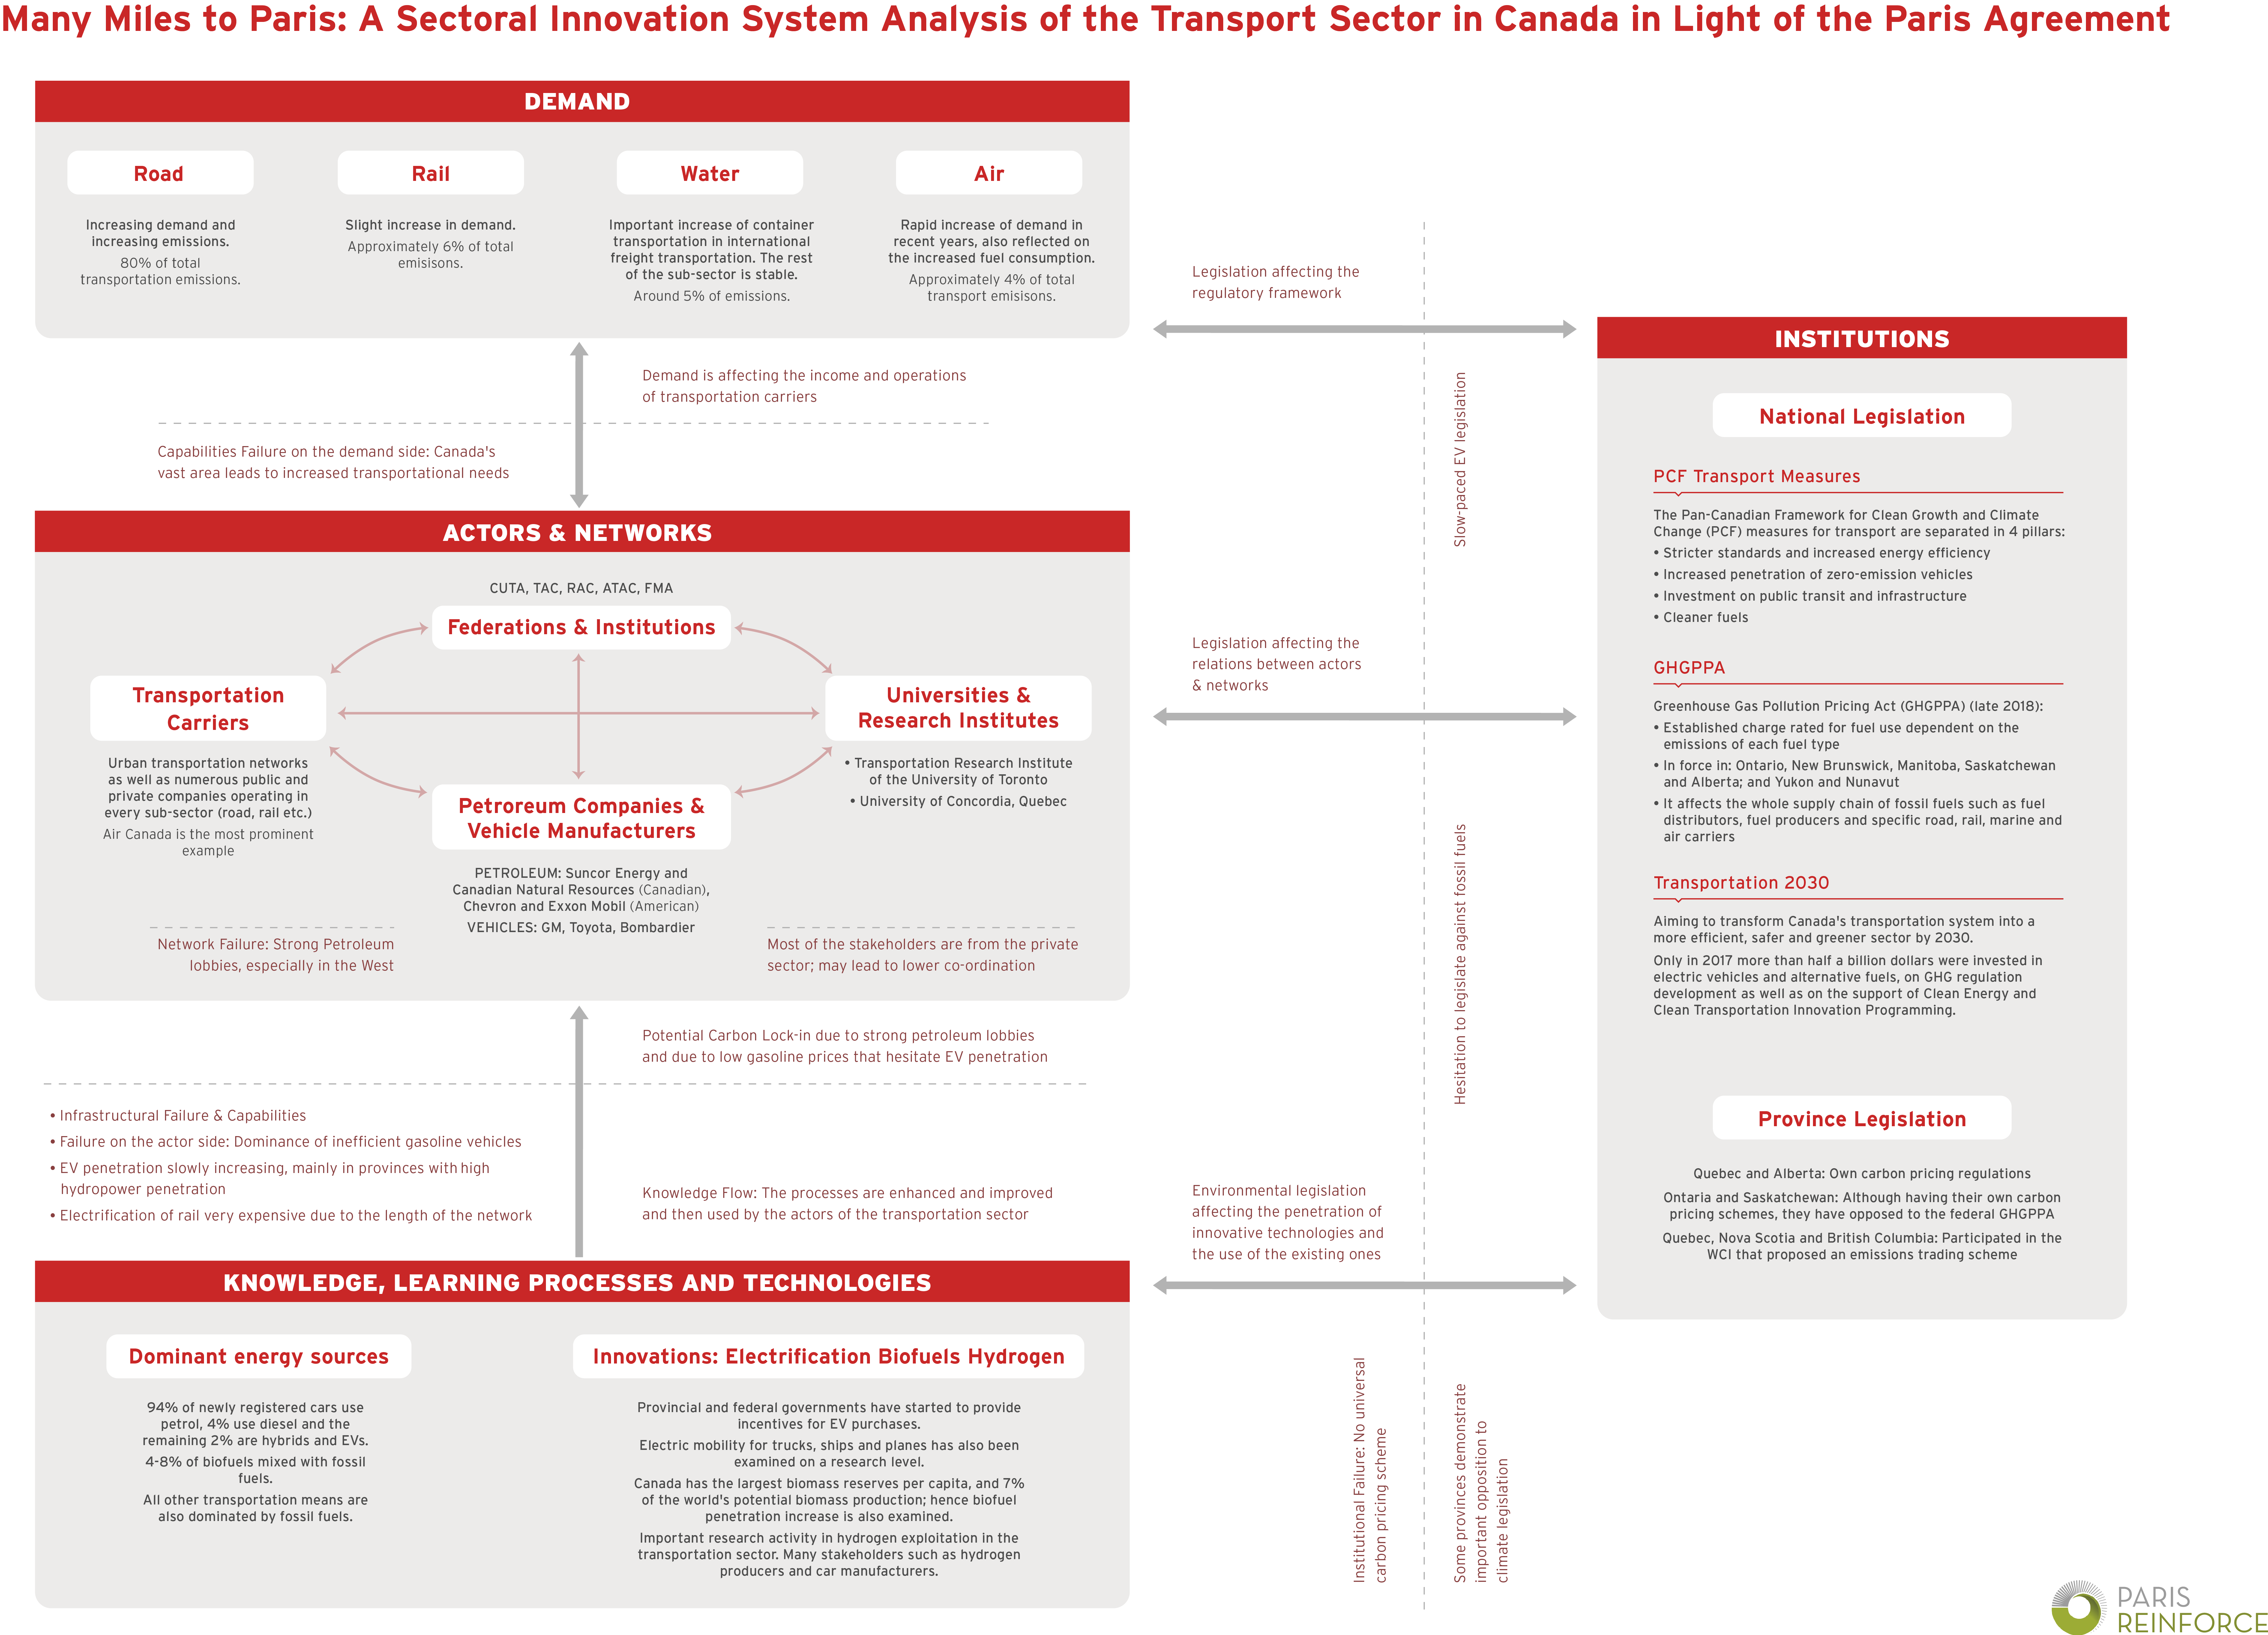
Many Miles to Paris: A Sectoral Innovation System Analysis of the Transport Sector in Canada in Light of the Paris Agreement
Description:
This infographic, based on the Sectoral Innovation Systems approach, attempts to identify the factors pacing down progress in the diffusion of electric vehicles in Canada. By utilising the System Failure framework, bottlenecks hindering the decarbonisation of the transport system are identified. The activity of oil companies, regional and federal legislative disputes in Canada and the lack of sincere efforts from system actors to address challenges lead to non-drastic greenhouse gas emission reductions, despite significant policy efforts. Insights into the effectiveness of previously implemented policies and the evolution of the sectoral system can help draw lessons towards sustainable transport.
The infographic is based on:
Koasidis, K., Karamaneas, A., Nikas, A., Neofytou, H., Hermansen, E. A., Vaillancourt, K., & Doukas, H. (2020). Many miles to Paris: A sectoral innovation system analysis of the transport sector in norway and canada in light of the Paris Agreement. Sustainability, 12(14), 5832.
Infographic:
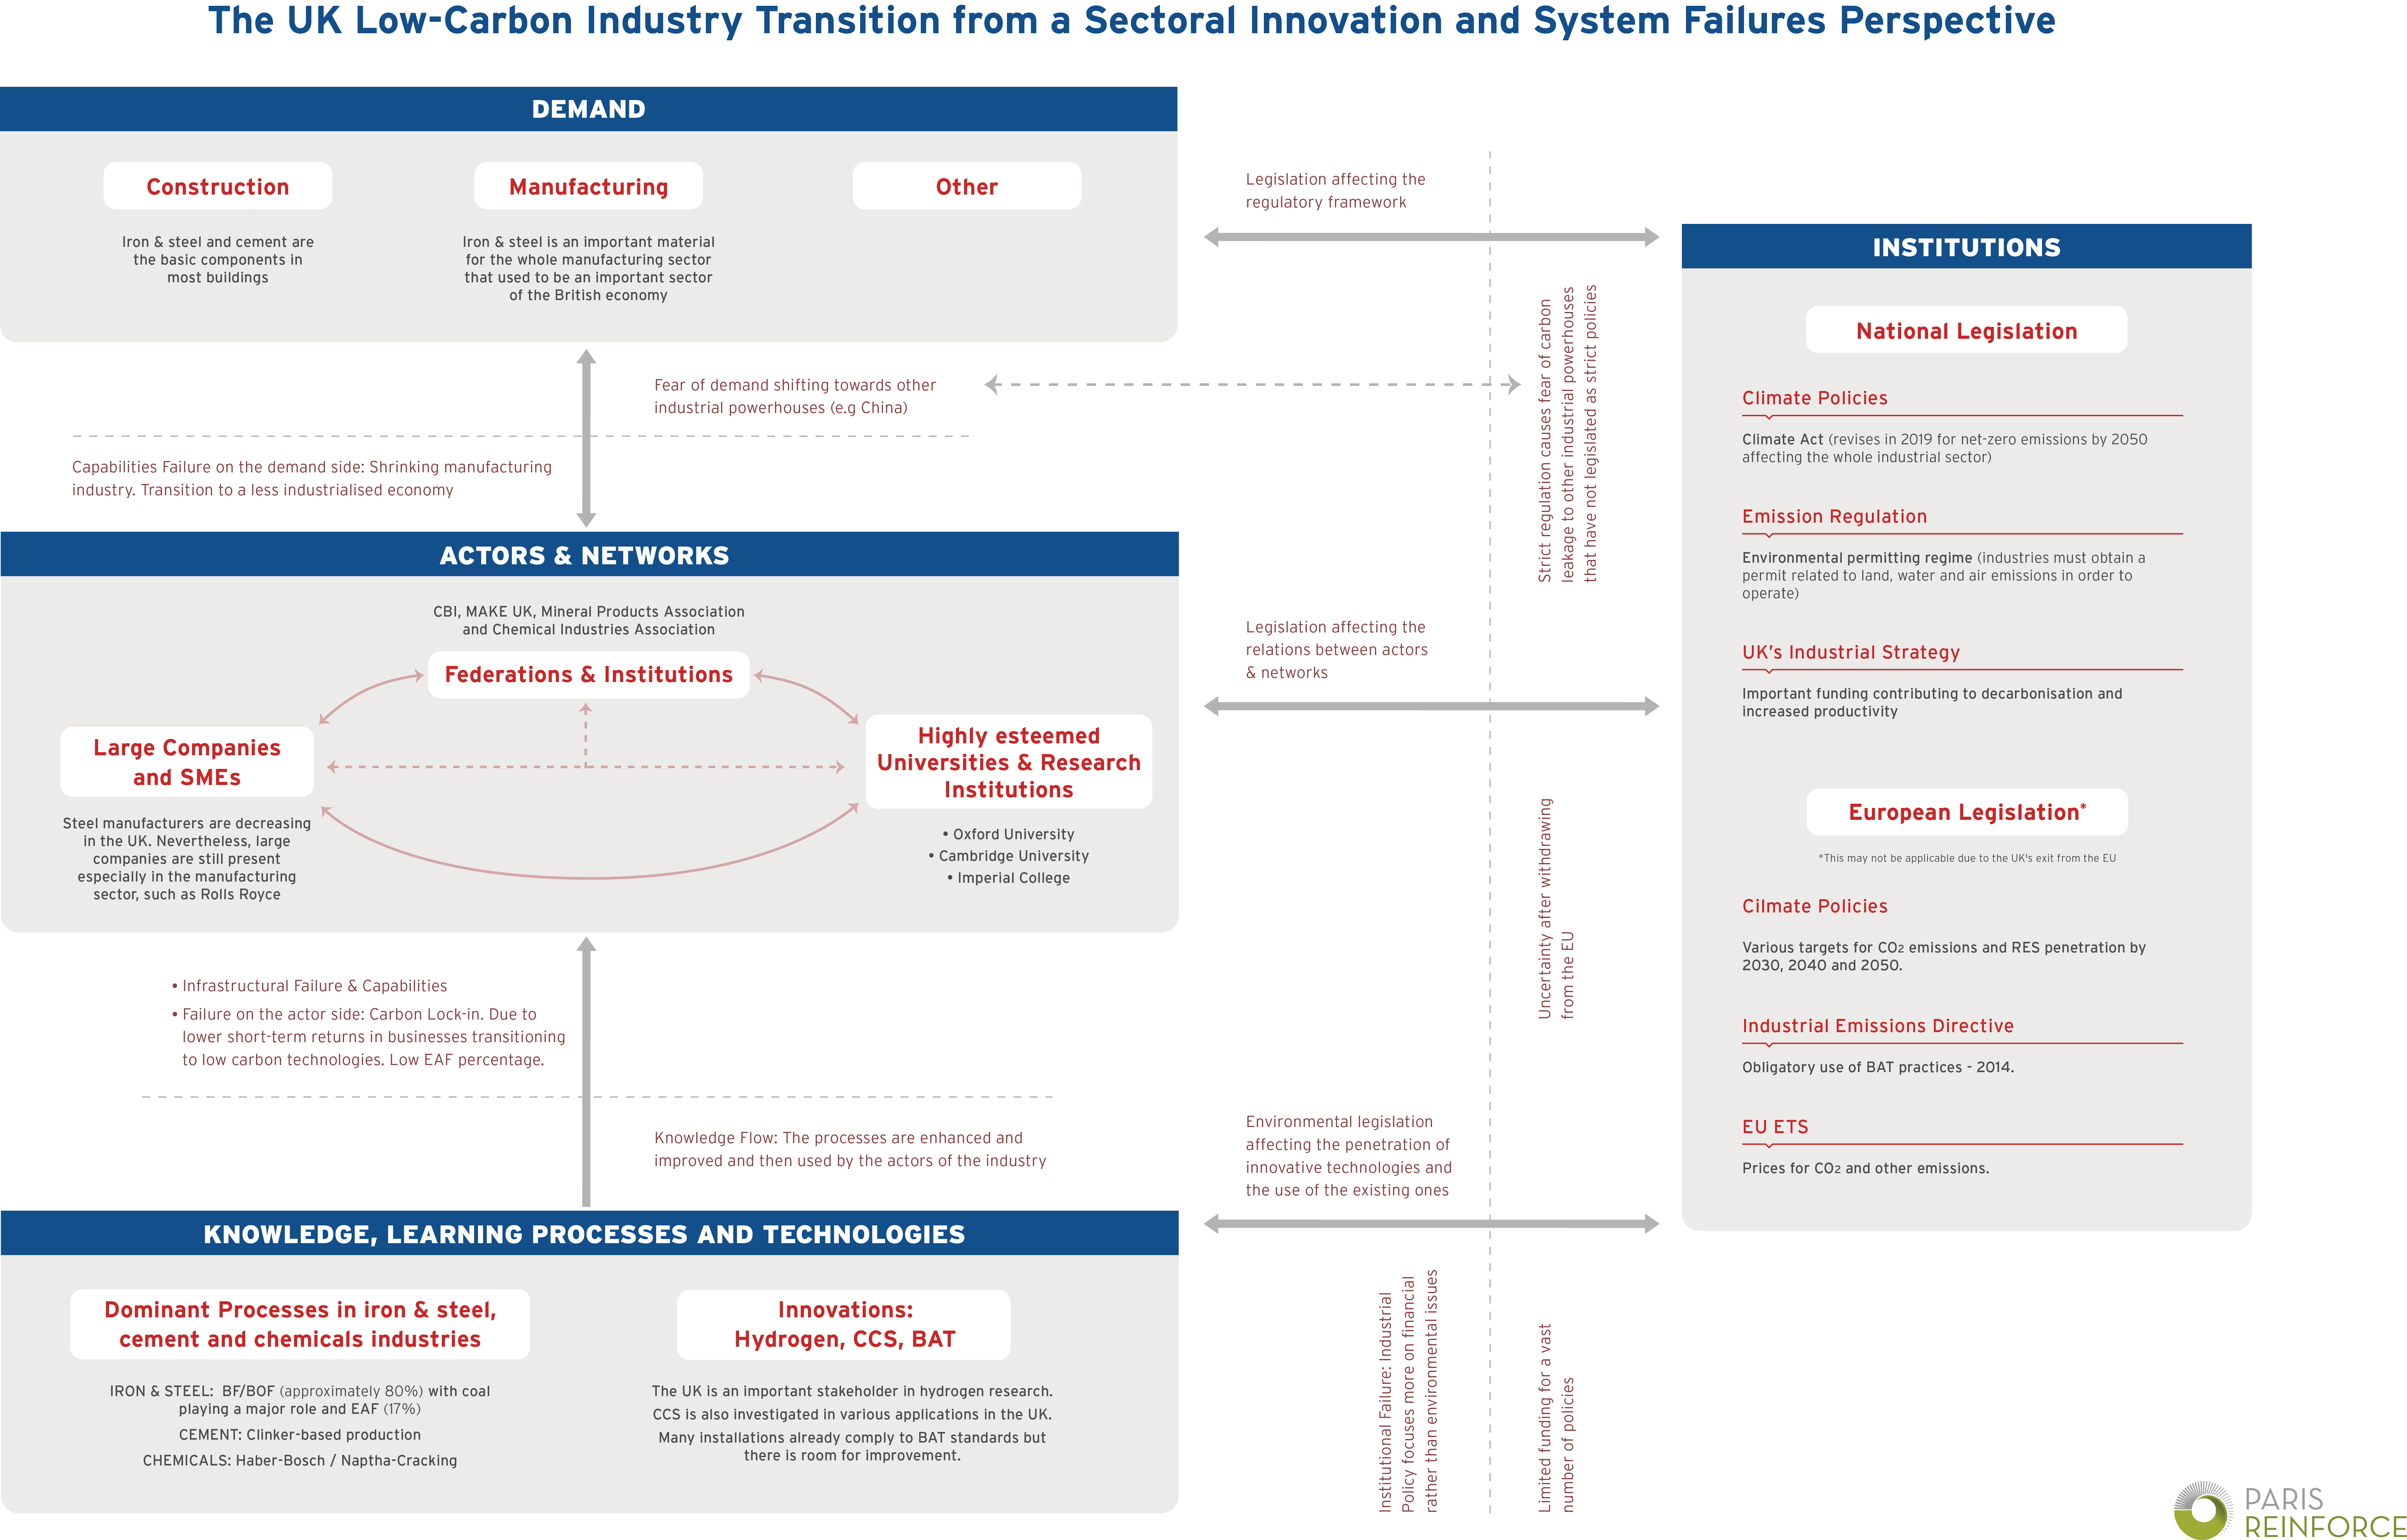
The UK Low-Carbon Industry Transition from a Sectoral Innovation and System Failures Perspective
Description:
This infographic reviews the energy-intensive iron and steel, cement and chemicals industries of the United Kingdom, a major emitting country with significant activity. Based on the Sectoral Innovation Systems and the Systems Failure framework, it aims to capture existing and potential drivers of or barriers to diffusion of sustainable industrial technologies and extract implications for policy. Results indicate that actor structures and inconsistent policies have limited low-carbon innovation. A key to UK industrial decarbonisation is to drive innovation and investment in the context of an industry in decline and in light of Brexit-related uncertainty.
The infographic is based on:
Koasidis, K., Nikas, A., Neofytou, H., Karamaneas, A., Gambhir, A., Wachsmuth, J., & Doukas, H. (2020). The UK and German Low-Carbon Industry Transitions from a Sectoral Innovation and System Failures Perspective. Energies, 13(19), 4994.
Infographic:
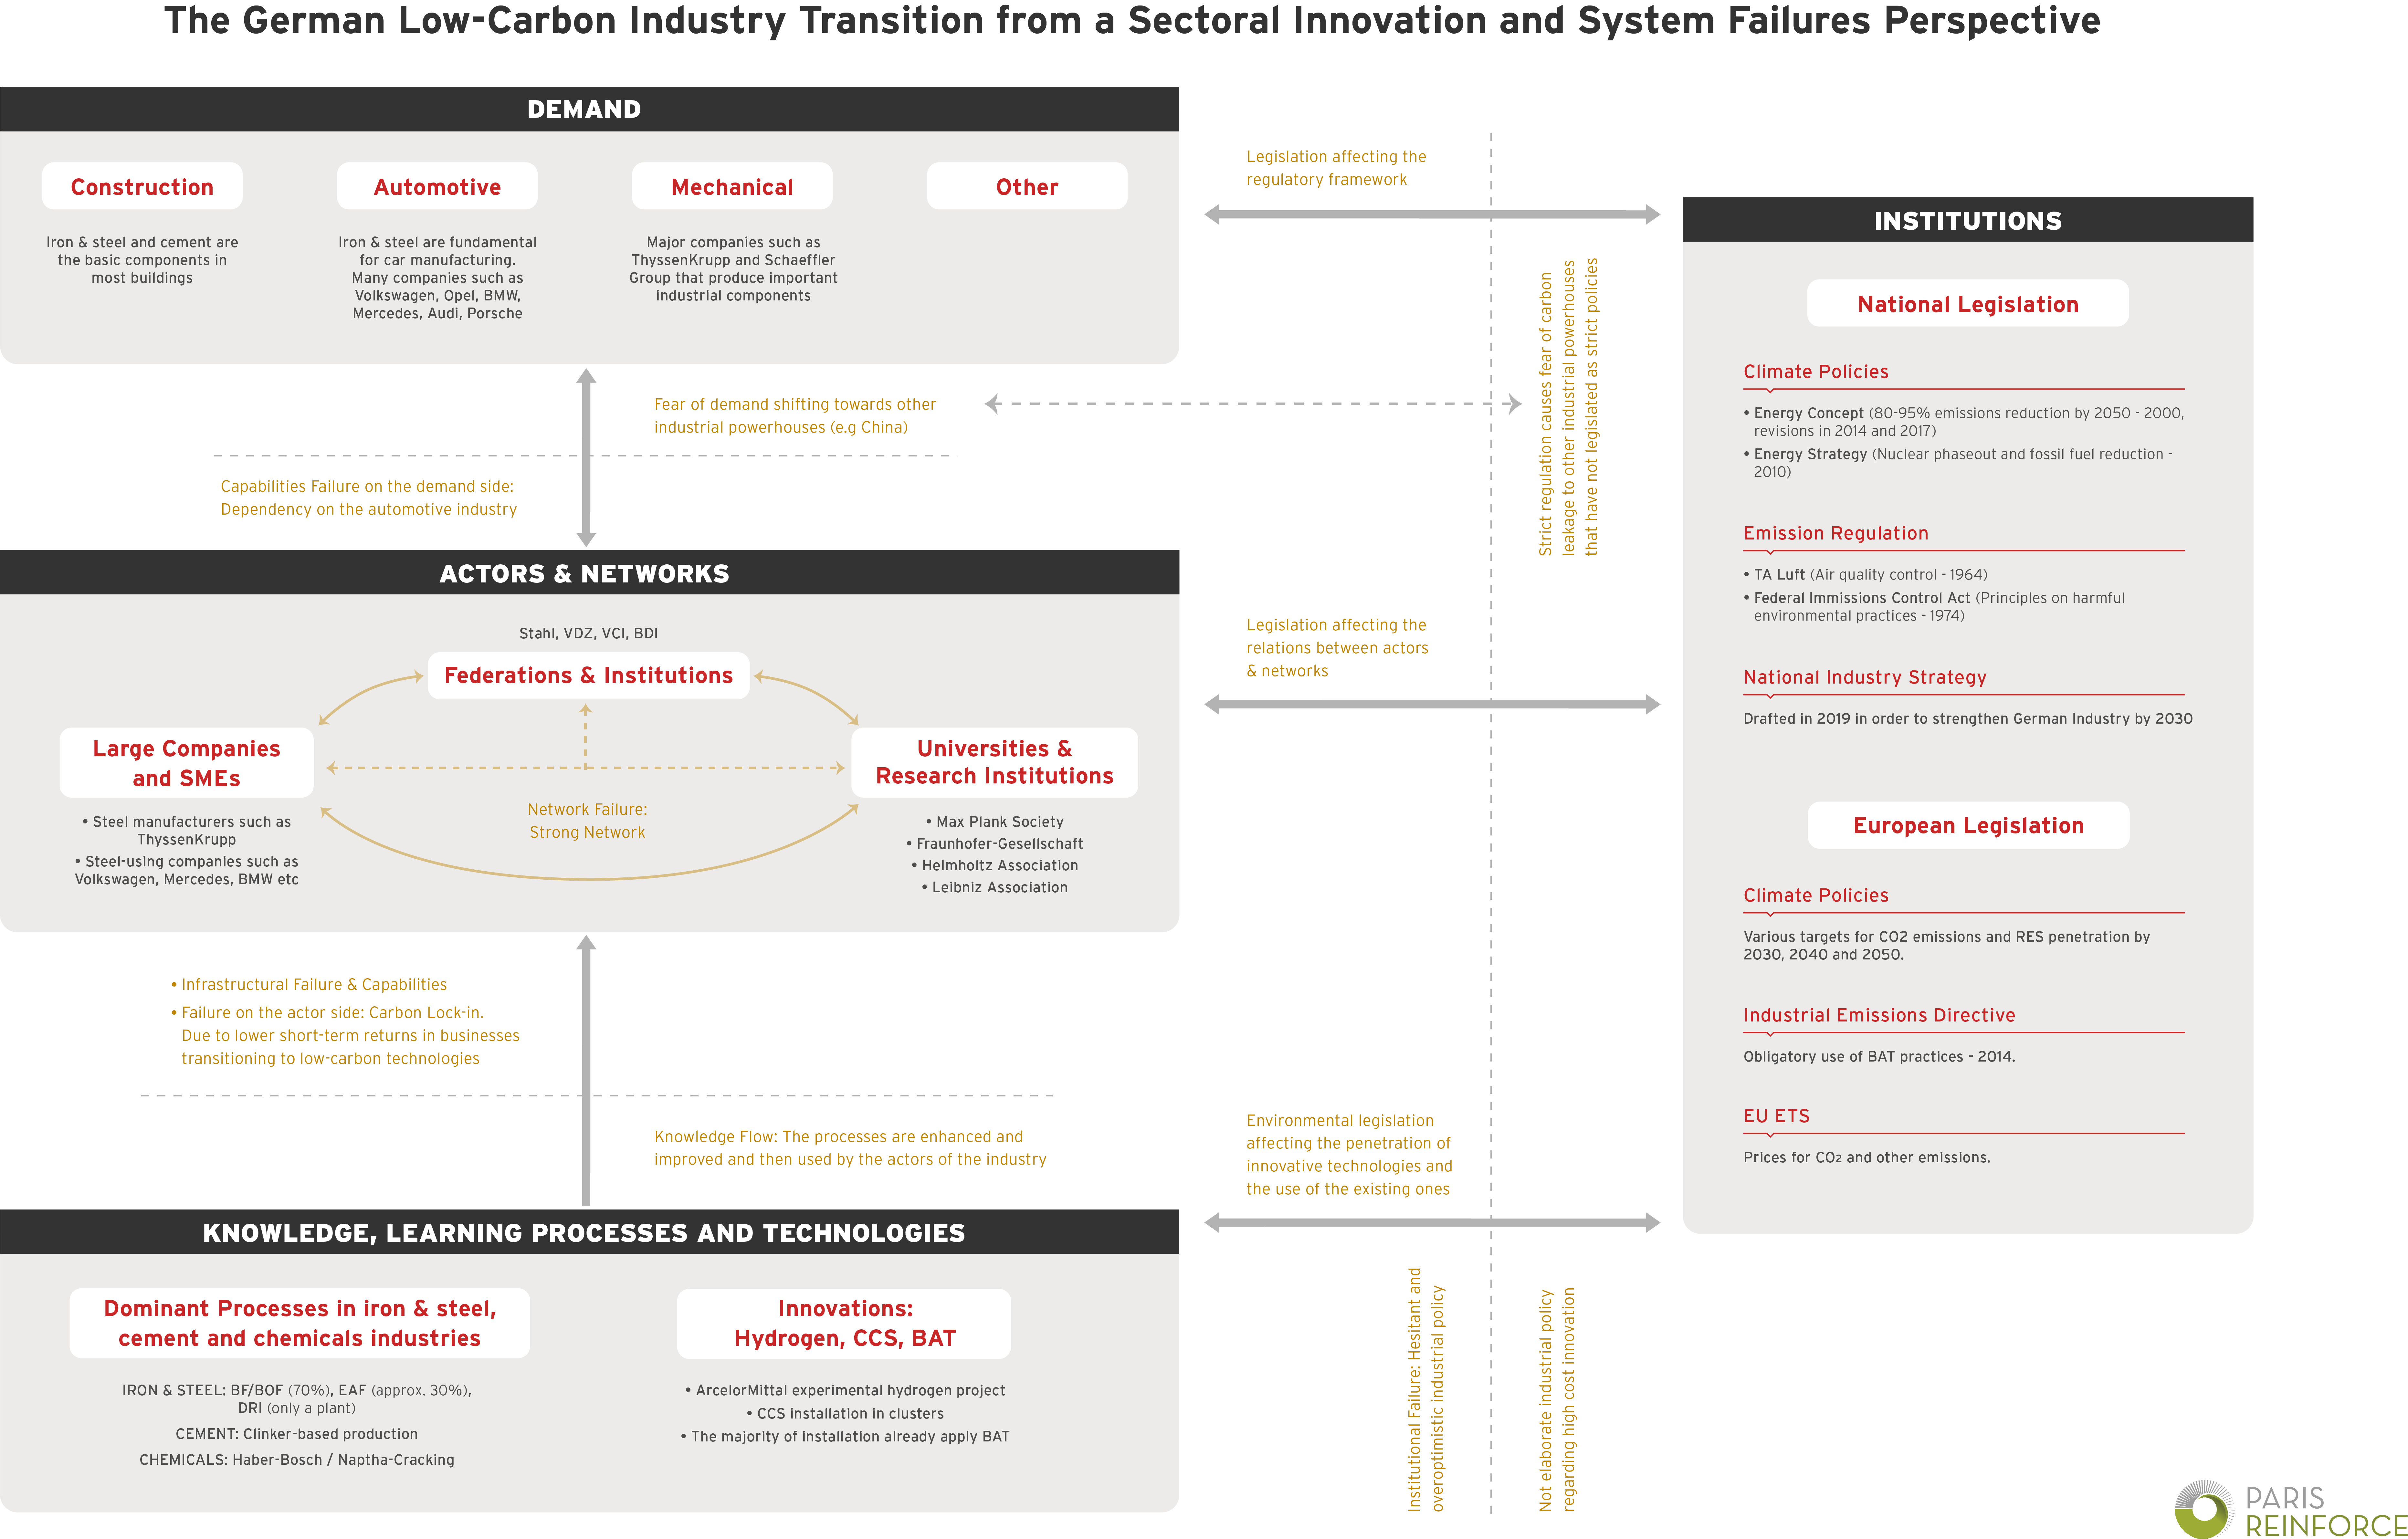
The German Low-Carbon Industry Transition from a Sectoral Innovation and System Failures Perspective
Description:
This infographic reviews the energy-intensive iron and steel, cement and chemicals industries of Germany, a major emitting country with significant activity. Based on the Sectoral Innovation Systems and the Systems Failure framework, it aims to capture existing and potential drivers of or barriers to diffusion of sustainable industrial technologies and extract implications for policy. Results indicate that actor structures and inconsistent policies have limited low-carbon innovation. A critical factor for the successful decarbonisation of German industry lies in overcoming lobbying and resistance to technological innovation caused by strong networks.
The infographic is based on:
Koasidis, K., Nikas, A., Neofytou, H., Karamaneas, A., Gambhir, A., Wachsmuth, J., & Doukas, H. (2020). The UK and German Low-Carbon Industry Transitions from a Sectoral Innovation and System Failures Perspective. Energies, 13(19), 4994.
Infographic:
A Multi-Level Perspective of Brazil’s Transport Decarbonisation Potential, Focusing on the Biodiesel Technological Innovation System
Description:
This infographic reviews the transport sector of Brazil and the emergence of biodiesel. Using the MLP and TIS frameworks, it sheds light on the historical evolution of the dominant regime of the Brazilian transport sector and helps understand how the dependency of fossil fuels was shaped in line with continuous pressures from oil, economic, and institutional crises from the landscape. It also highlights the emergence of the biodiesel technological system, its interactions with other technologies, and the progress that allowed it to break through from a niche and become part of the regime.
Infographic:

A Multi-Level Perspective of Argentina’s Transport Decarbonisation Potential, Focusing on the Biodiesel Technological Innovation System
Description:
This infographic reviews the transport sector of Argentina and the emergence of biodiesel. Using the MLP and TIS frameworks, it sheds light on the historical evolution of the dominant regime of the Argentinian transport sector and helps understand how the dependency of fossil fuels was shaped in line with continuous pressures from oil, economic, and institutional crises from the landscape. It also highlights the emergence of the biodiesel technological system, its interactions with other technologies, and the progress that allowed it to break through from a niche and become part of the regime.
Infographic: